
Investigation workbench
What this page covers
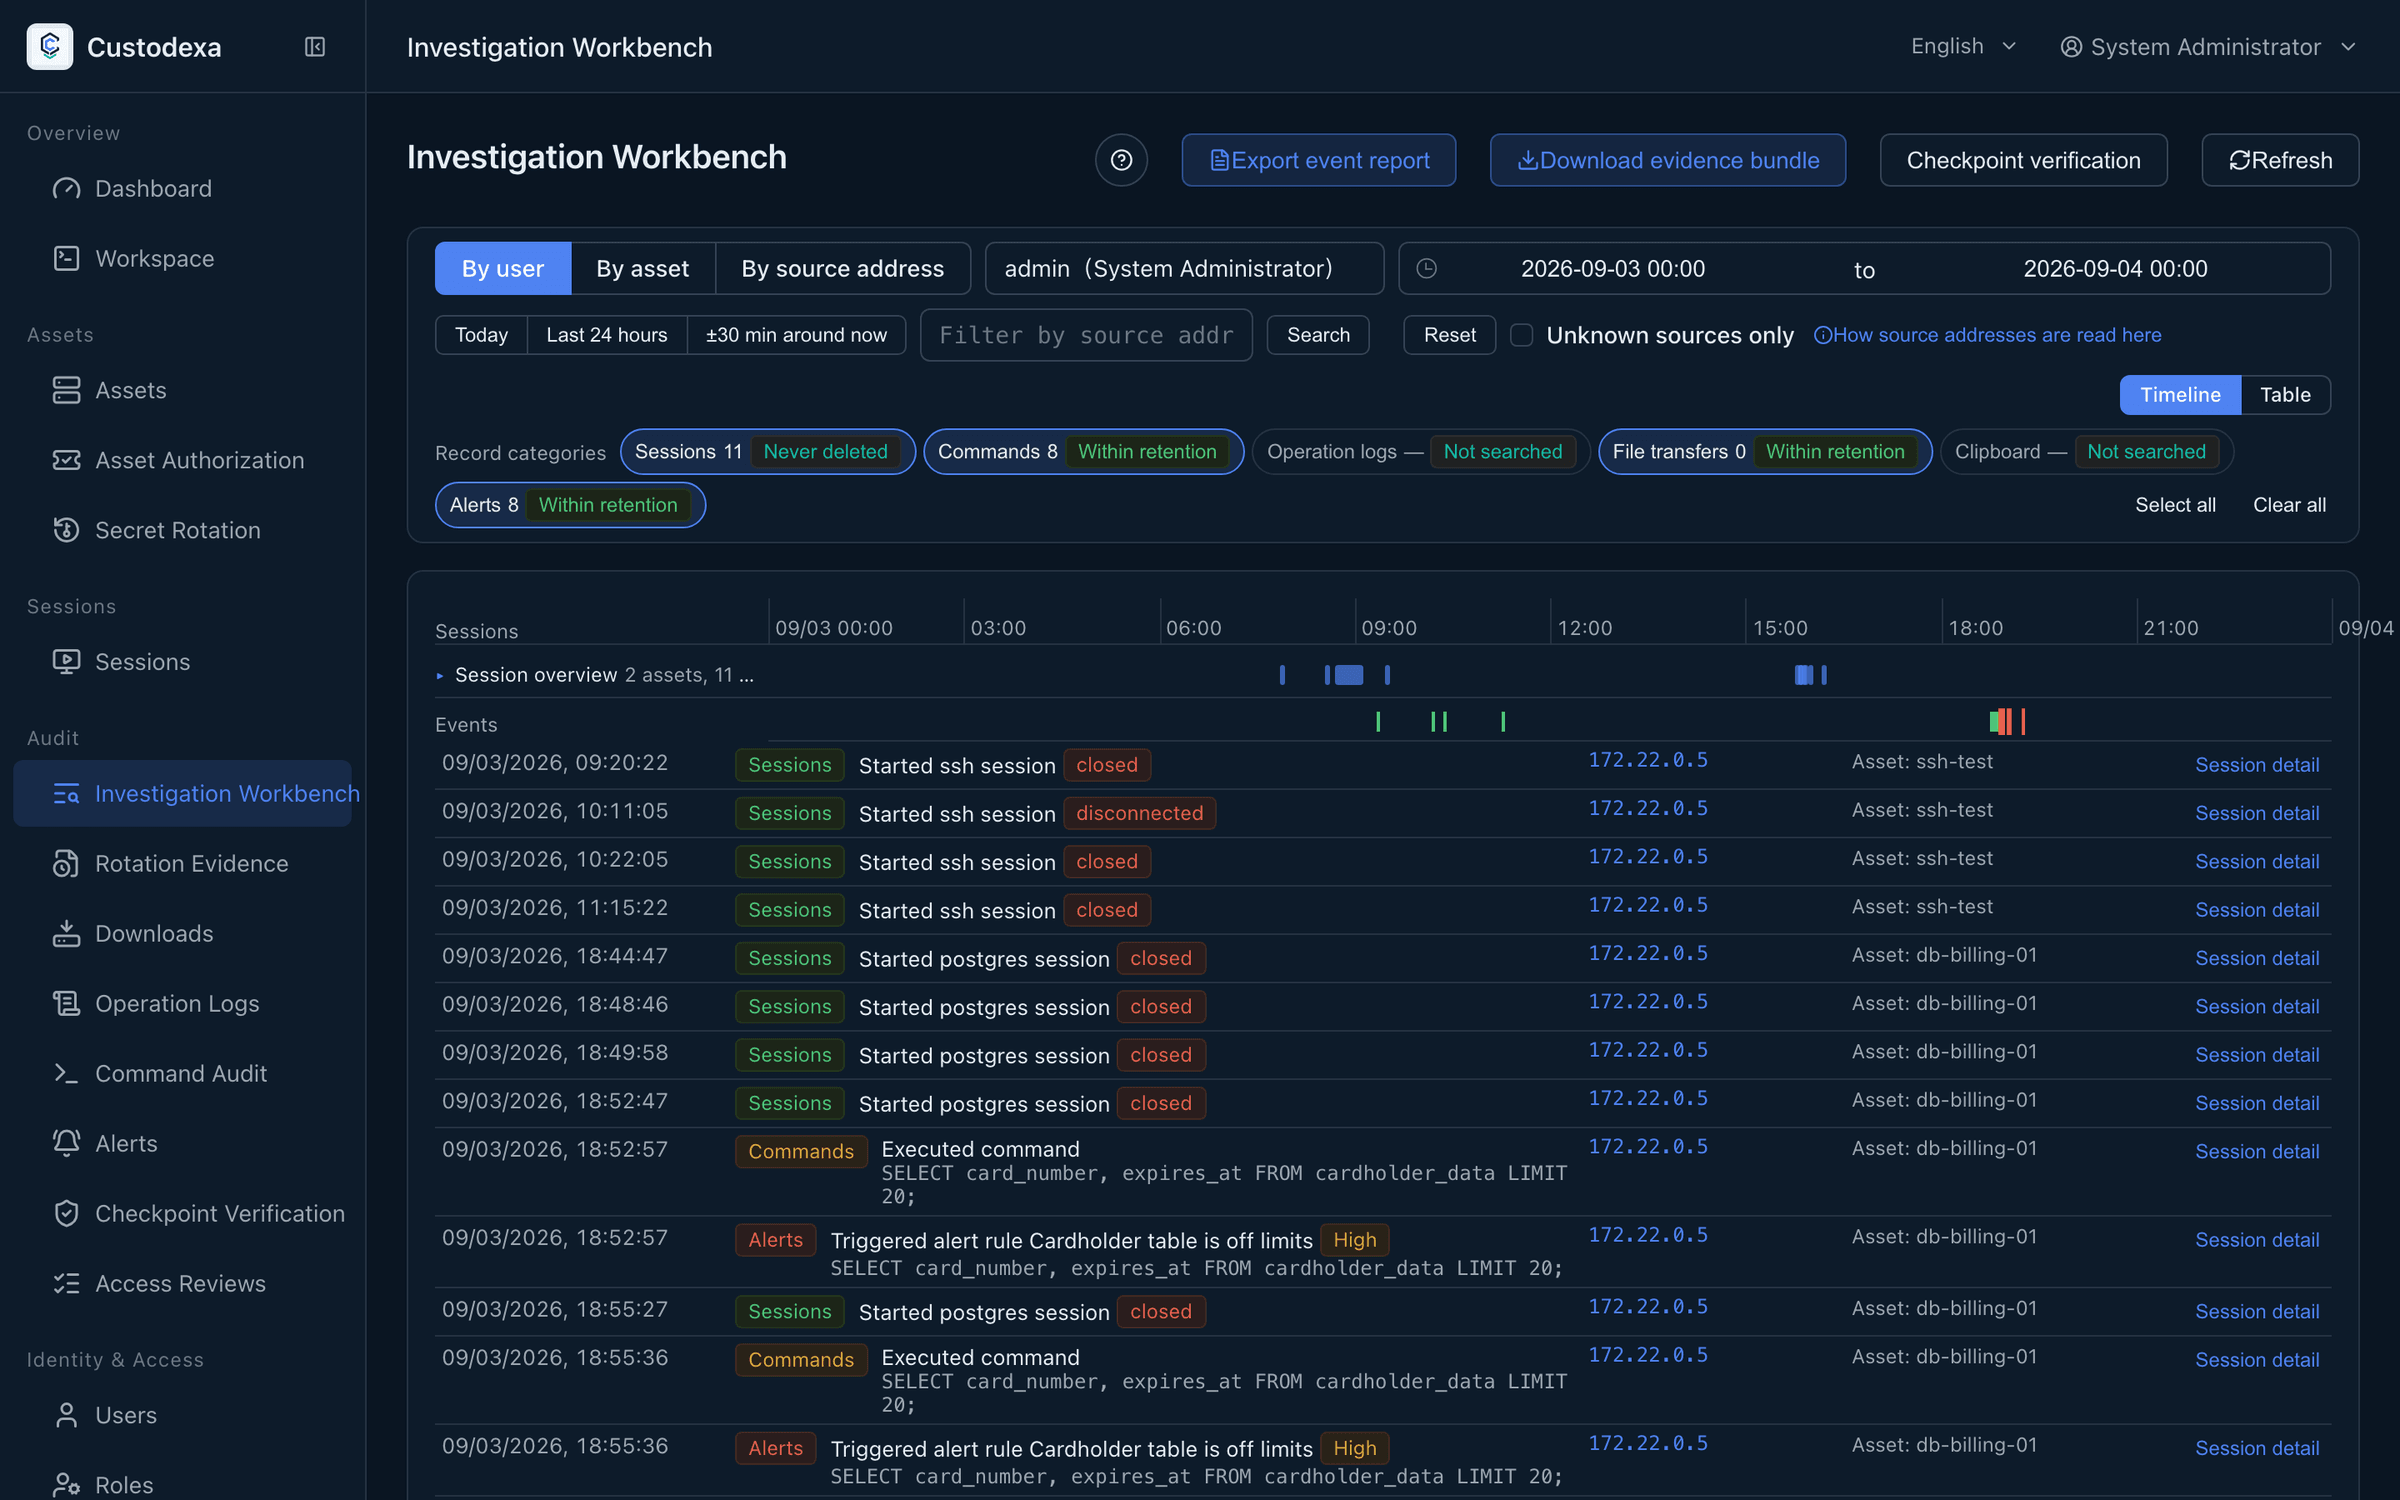
Section titled “What this page covers”Finding out what a person, an asset, or a source address did in a given period. Connections, commands, operation logs, file transfers, clipboard events, and alerts come onto one timeline, and an export starts from there. This page is read-only and changes no record; proof of integrity is issued by the checkpoint chain.
What you need
Section titled “What you need”Audit view permission. The workbench sees exactly what that permission covers, which is every user and every asset, and it does not narrow to the investigator’s own asset grants.
How to use it
Section titled “How to use it”- Choose a pivot: by person, by asset, or by source address.
- Choose the subject: the first two use the search box; the address pivot takes a complete IPv4 or IPv6 address.
- Set the time window: fill in a start and end, or use a shortcut such as today, the last 24 hours, or 30 minutes either side of now.
- Choose categories: the six can be ticked individually. A category left unticked reads “not included in the query” rather than a count of 0.
- Switch views: timeline or table.
The filter row also carries a source address filter and an “unknown sources only” switch, which are mutually exclusive.
The investigation state is encoded completely in the address, pivot, subject, time window, categories, focused event, and address filter included, so one link hands a colleague the same view.
How addresses connect
Section titled “How addresses connect”Under the person and asset pivots, the source address on an event row and a connection row is a link that switches to a new investigation pivoted on that address, keeping the time window and category selection. In the other direction, events under the address pivot carry the operator and asset on the other side.
Address matching is exact after normalization on the server, and a query covers one address. When no address is available it reads as unknown, and says whether the reason is a system action, an address that could not be parsed, or a session that could not be found.
What is on the screen
Section titled “What is on the screen”- Connection overview: aggregated by asset first, expanding to one row per session. Each session says whether the recording can be played back, was purged under the retention policy, or has no recording file.
- Event details: time, category, summary, the other party, account, protocol, start and end, recording, source address, and operator.
- Coverage badges: per category, marked as within retention, purged under policy, or never purged. On purged under policy, the badge adds the retention days, the most recent purge time, the matching sealing sequence range, and a way to the verification page.
- Clipboard events carry no content on the timeline, and a separate entrance takes you to the content view for that session and positions playback at that moment.
When there are too many events, the screen shows part of them and says it has truncated; the per-category counts on the filter row are the real totals for the period and are unaffected by the screen ceiling.
Starting an export from the investigation scope
Section titled “Starting an export from the investigation scope”The toolbar carries “Export event report” and “Download evidence bundle”, which carry over the current subject, time window, and categories; see Evidence bundles and event reports for the details. An export covers the query scope, not the page already loaded.
What auditors can see
Section titled “What auditors can see”- Every query against the workbench leaves a record in itself, with a summary of the criteria.
- Event summaries come back as a machine code plus parameters and are rendered by the interface, so one event means the same thing in all three languages.
- The page carries a section on where source addresses come from and where they stop: what unknown means, how to read them behind a proxy, and what carries each case.